

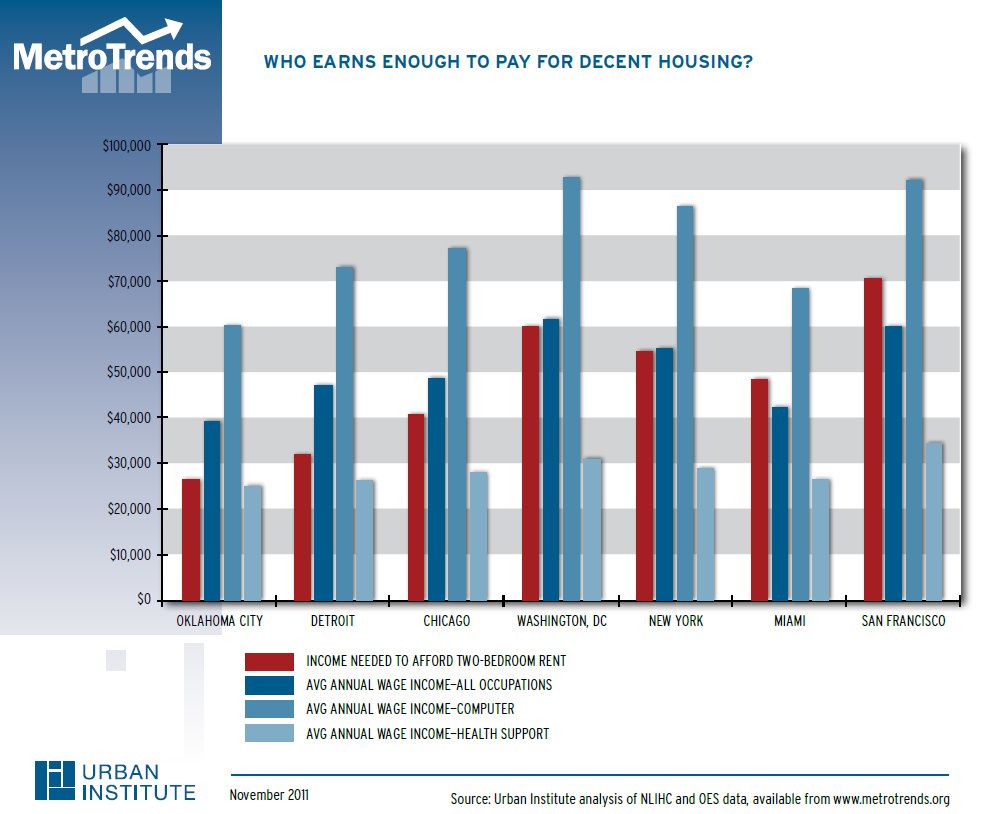
The Metro Trends element of the Urban Institute says that it's Oklahoma City. In an article named, "Are Some Metros Better for the 99%?" on December 5, 2011, Margery Turner of Metro Trends gave a hint that Oklahoma City might fare well in an answer to that question in the tantalizing chart below (click on the chart and most other images in this post for a larger image):
On December 6, I received an email from Andrew Maddocks, a representative of Metro Trends/Urban Institute with this kindly message:
Hello from from a think tank in Washington D.C.! I hope all's well with you on this fine Tuesday.Well, it doesn't take all that much for me to get wholly puffed up, but the initial article didn't give much detail about Oklahoma City, simply saying that,
We just published a blog mentioning Oklahoma City as one of the best cities in the country for low unemployment and affordable housing. Here's the key: "Somehow, it avoided the excesses of the boom years, and its economy has weathered the downturn better than most."
I wondered if you thought your readers might be interested in how their city compares to others around the country. If you're at all interested in linking to the post or re-posting, please let me know. You've clearly got a substantial readership there, and I'd love to share what the people at Urban are writing!
One region that looks good on these metrics is Oklahoma City. Somehow, it avoided the excesses of the boom years, and its economy has weathered the downturn better than most. Housing costs are low, and though wages are too, a personal service worker can almost afford the rent for a two-bedroom apartment. And at 5 percent, Oklahoma City’s unemployment rate is among the lowest in the country.With those tantalizing remarks, I replied that I would but only after more detail was presented about Oklahoma City. Today, December 14, that additional detail was provided in a follow-up article, and it has some pretty darn cool things to say about our city and includes a great interactive map reflecting that our city just doesn't do well in comparative scores in the top 100 metro markets, IT SCORES #1, BEST OF ALL.
What can we learn from the Oklahoma City metro about keeping wages and housing costs in better balance through both good times and bad? For my next blog, I’ll track down some possible answers.
The Study Interactive Map 100 City Summary
PRELIMINARY REMARKS. Before getting to the heart of the matter, it's probably best to know a bit about who's doing the analysis and original reporting so we'll get a measure of how seriously that analysis and reporting should be taken. Here's that bit.
About Urban Institute & Metro Trends. According to Wikipedia, the Urban Institute was established in 1968 by President Lyndon Johnson as "a Washington, D.C. based think tank that carries out nonpartisan economic and social policy research, collects data, evaluates social programs, educates the public on key domestic issues, and provides advice and technical assistance to developing governments abroad." The article says that it has a staff of about 350 and that its president is Robert D. Reischauer, former head of the Congressional Budget Office. There's more, but that's enough for me to take the organization seriously. According to this page at MetroTrends, MetroTrends is "the Urban Institute's report card on how metropolitan America is faring."
 About Margery Turner. Metro Trends identifies her as Vice President for Research at the Urban Institute and says,
A nationally recognized expert on urban policy and neighborhood issues, Ms. Turner has analyzed issues of residential location, racial and ethnic discrimination and its contribution to neighborhood segregation and inequality, and the role of housing policies in promoting residential mobility and location choice. She served as Deputy Assistant Secretary for Research at the Department of Housing and Urban Development from 1993 through 1996, and is co-author of Public Housing and the Legacy of Segregation.Her Facebook page says that she is from New York (Ithaca HS 1973) and has degrees from Cornell University (1977, Government) and George Washington University (1983, Urban and Regional Planning). And she plays the flute. That's good enough for me.
About The Study. It's best to keep in mind that this survey is solely about economics — it's not about quality of life or other urban pleasantries (or unpleasantries). It's about cities that have fared well and poorly through what the article calls the Great Recession (2nd quarter of 2007 through the 3rd quarter of 2011) and its focus is to identify cities that have fared well and poorly as measured by 4 criteria during that study period: (1) change in housing prices; (2) unemployment; (3) affordable housing for low wage workers; and (4) mortgage delinquency. Remember, this series of articles has to do with the 99%, not the 1%. If you are in the 99%, then these articles are about you.
The December 14 Report Card. Ms. Turner's December 14 article is titled, "Best and Worst Metros ... A Report Card on Economic Security." Among other things, Ms. Turner writes:
Metropolitan Oklahoma City’s diverse economy – including government, universities, energy, and high-tech firms -- has held up well in the Great Recession. It didn’t fall victim to the housing boom and bust (2000 to 2007), so rents and house prices today are remarkably affordable and few homeowners are facing foreclosure. And the region scores high on lots of “top ten” lists -- most affordable (Forbes), most recession-proof (Forbes), and best to start a small business (Fortune Small Business).Unlike me, she appears to be a person of few words — she didn't name all of those "best" lists which have come out strongly for the city over the past couple of years in various categories, but that's a good enough start.
So I decided to grade all of the nation’s 100 biggest metros: which are best and which are worst for family economic security?
The Cool Interactive Map. This is the fun part. Without reading a thing in the article, scrolling down a bit presents this map of the country ...
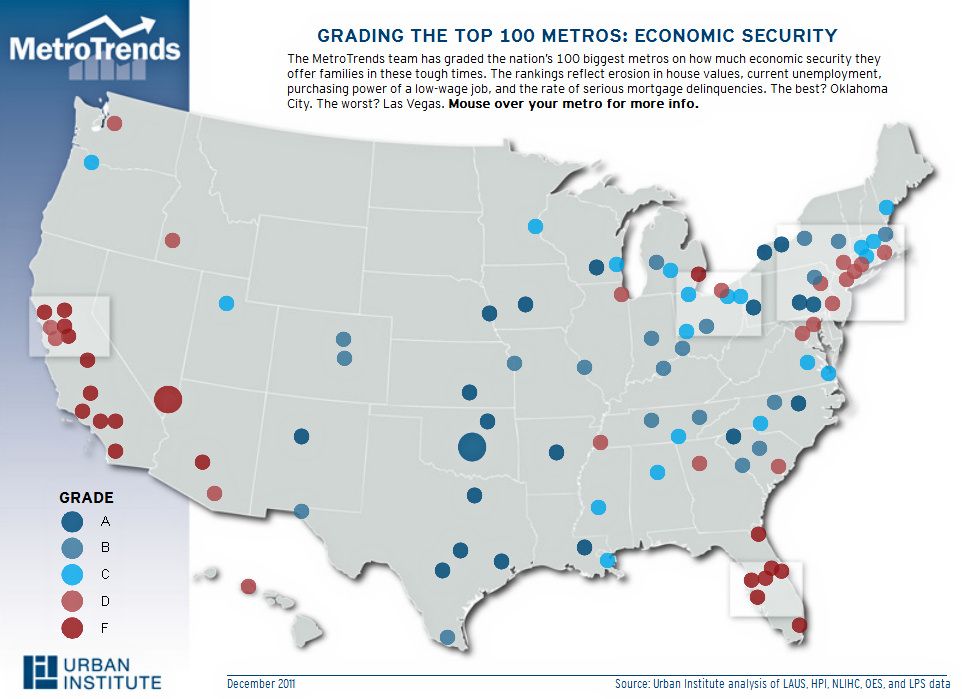
Why does only Oklahoma City have that big blue dot? If that isn't enough to catch the attention of an Oklahoma Citian, what would be?
By clicking on that graphic, an exceptionally cool interactive map appears in which one can mouse-over a city to get snapshot of the study results:
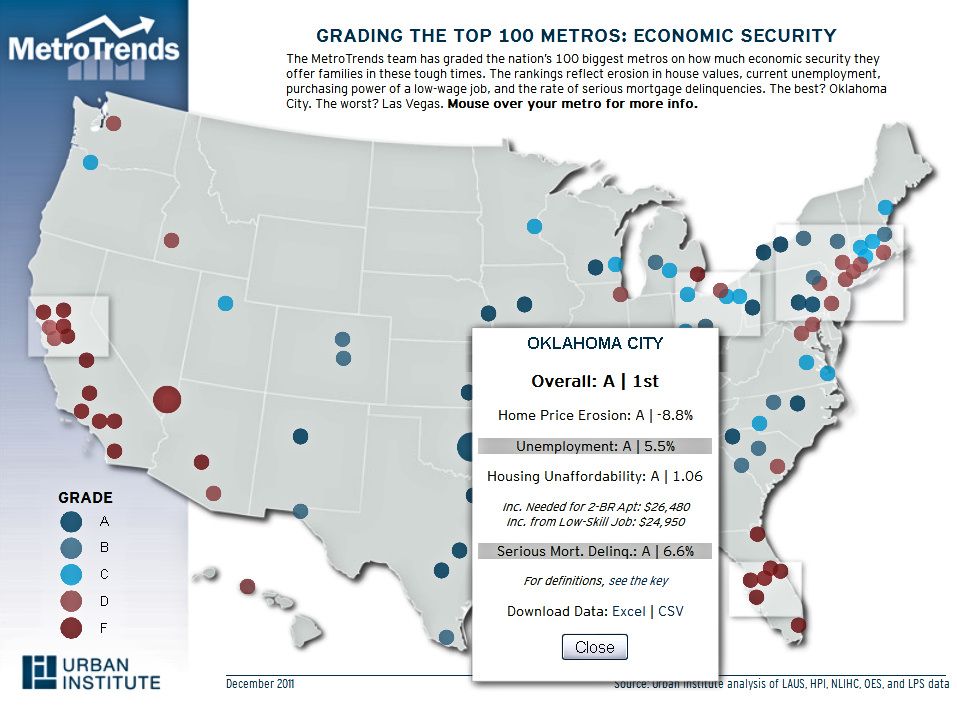
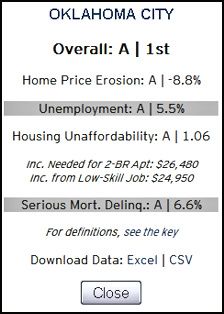 Although you can click on any of the charts and maps shown in this post to get a larger view, here's the crop of the Oklahoma City summary shown in the above map. Note that one can download a much more detailed spreadsheet (Excel or comma delimited) file which I've done and will get back to shortly.
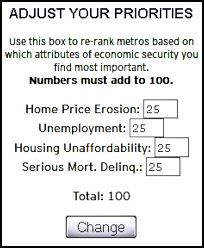 But for those who mainly want to play with that map, it is very easily done. The map also gives a reader the ability to change the weight given the 4 factors previously mentioned, if one doesn't like the equal (25%) weight given by the Urban Institute to the 4 factors used in reaching the conclusions that it did.
OK OK. If you've read my blog for very long, you already know that I'm a "map person." So let's play with the map. To play with the map in MetroTrends, click here. Or, you can play with it below, although you'll have to do more scrolling than in the MetroTrends location ... use the horizontal scroll bar at the bottom or the vertical scroll bar at the right.
Study Summaries. As said previously (and see Additional Resources, below), I've downloaded the Excel spreadsheet which gives much greater detail than the interactive map summaries do. The following table presents a summary of the spreadsheet data combined with the interactive map A-F scores which the spreadsheet does not reflect. About the latter, I've mouse-overed each of the 100 cities in the map to get city scores, A-F, which scores are not contained in the spreadsheet. I've truncated metropolitan area names to show only the 1st city name for metropolitan areas that have more than one city name in the metropolitan area name and have substituted an abbreviated form of "et al." (meaning and others) to be simply "etal." For example, in the Excel spreadsheet, the Nashville metro area is "Nashville-Davidson-Murfreesboro-Franklin, TN" but I've abbreviated that below to be "Nashville etal, TN." The top 50 metro areas are in the left column and the last 50 are in the right.
| Metropolitan Area | Rank | Score | Metropolitan Area | Rank | Score | |
| Oklahoma City, OK | 1 | A | New Orleans etal, LA | 51 | C | |
| Omaha etal, IA | 2 | A | Richmond, VA | 52 | C | |
| Wichita, KS | 3 | A | Akron, OH | 53 | C | |
| Tulsa, OK | 4 | A | Lansing etal, MI | 54 | C | |
| Des Moines, IA | 5 | A | Springfield, MA | 55 | C | |
| Pittsburgh, PA | 6 | A | Salt Lake City, UT | 56 | C | |
| Madison, WI | 7 | A | Virginia Beach etal, VA-NC | 57 | C | |
| Austin etal, TX | 8 | A | Charlotte etal, NC-SC | 58 | C | |
| Baton Rouge, LA | 9 | A | Youngstown etal, OH-PA | 59 | C | |
| Buffalo etal, NY | 10 | A | Worcester, MA | 60 | C | |
| Little Rock etal, AR | 11 | A | Allentown etal, PA-NJ | 61 | C | |
| Lancaster, PA | 12 | A | Cleveland etal, OH | 62 | D | |
| San Antonio, TX | 13 | A | Honolulu, HI | 63 | D | |
| Harrisburg etal, PA | 14 | A | Philadelphia etal, PA-NJ-DE-MD | 64 | D | |
| Rochester, NY | 15 | A | Charleston etal, SC | 65 | D | |
| Greenville etal, SC | 16 | A | Bridgeport etal,CT | 66 | D | |
| Houston etal, TX | 17 | A | Baltimore etal, MD | 67 | D | |
| Dallas etal, TX | 18 | A | New Haven etal, CT | 68 | D | |
| Albuquerque, NM | 19 | A | Providence etal, RI-MA | 69 | D | |
| Raleigh et al, NC | 20 | A | Seattle etal, WA | 70 | D | |
| El Paso, TX | 21 | B | Atlanta etal, GA | 71 | D | |
| Denver etal, CO | 22 | B | Tuscon, AZ | 72 | D | |
| Knoxville, TN | 23 | B | Boise City etal, ID | 73 | D | |
| Syracuse, NY | 24 | B | New York etal, NY-NJ-PA | 74 | D | |
| Scranton etal, PA | 25 | B | Memphis, TN-MS-AR | 75 | D | |
| Colorado Springs, CO | 26 | B | Washington etal, DC-VA-MD-WV | 76 | D | |
| Nashville etal, TN | 27 | B | Poughkeepsie etal, NY | 77 | D | |
| Augusta etal, GA-SC | 28 | B | Chicago etal, IL-IN-WI | 78 | D | |
| Louisville etal, TN-KY | 29 | B | San Francisco etal, CA | 79 | D | |
| Albany etal, NY | 30 | B | San Jose etal, CA | 80 | D | |
| Grand Rapids etal, MI | 31 | B | Detroit etal, MI | 81 | F | |
| Columbia, SC | 32 | B | Santa Rosa etal, CA | 82 | F | |
| Columbus, OH | 33 | B | San Deigo etal, CA | 83 | F | |
| St. Louis, MO-IL | 34 | B | Phoenix etal, AZ | 84 | F | |
| Indianapolis etal, IN | 35 | B | Oxnard etal, CA | 85 | F | |
| Kansas City, MO-IL | 36 | B | Jacksonville, FL | 86 | F | |
| McAllen etal, TX | 37 | B | Los Angeles etal, CA | 87 | F | |
| Boston etal, MA-NH | 38 | B | Sacrameto etal, CA | 88 | F | |
| Cincinnati et al, OH-KY-IN | 39 | B | Fresno, CA | 89 | F | |
| Greensboro etal, NCMA-NH | 40 | B | Bakersfield, CA | 90 | F | |
| Minneapolis et al, MN-WI | 41 | C | Palm Bay etal, FL | 91 | F | |
| Chatanooga, TN-GA | 42 | C | Tampa etal, FL | 92 | F | |
| Birgmingham etal, AL | 43 | C | Lakeland etal, FL | 93 | F | |
| Jackson, MS | 44 | C | Bradenton etal, FL | 94 | F | |
| Hartford etal, CT | 45 | C | Riverside etal, CA | 95 | F | |
| Toldeo, OH | 46 | C | Orlando, FL | 96 | F | |
| Portland etal, OR-WA | 47 | C | Modesto, CA | 97 | F | |
| Milwaukee etal, WI | 48 | C | Stocton, CA | 98 | F | |
| Dayton, OH | 49 | C | Miami et al, FL | 99 | F | |
| Portland etal, ME | 50 | C | Las Vegas etal, NV | 100 | F |
Additional Resources: Steve Lackmeyer published a brief article about this in the December 15, Oklahoman. I've also modified the original Excel file for it to be a bit more readable, and to add a tab/page in the file for the summary shown above. Click here to download that file. Or, click here for the original Excel file without my tampering.


2 comments:
Thanks for your great piece on the Urban Institute's MetroTrends report card. We'd be interested in learning more from you and your readers about what you think makes Greater Oklahoma City #1. And maybe anything you think still "needs improvement." Glad you like the interactive map. We'll be posting more like it in the New Year.
You're welcome, Margery, but thank YOU for the article and research that you did. More about why I and those who live here think that Okc is #1? Where to begin ...
Post a Comment